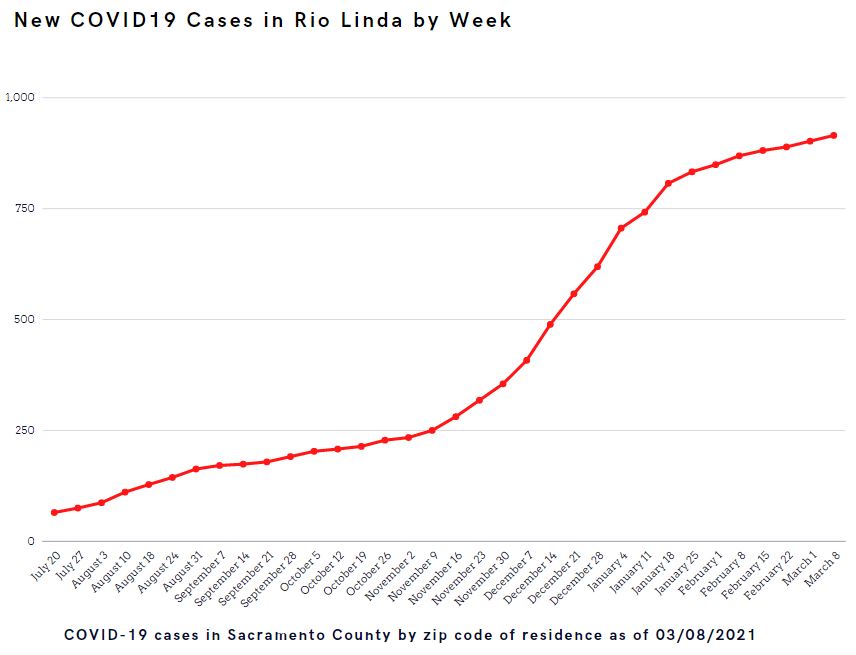
The number of newly identified COVID cases in Rio Linda has risen to over 900 to begin March, as we reach the 1st year anniversary of COVID being detected in Sacramento County.
The trendline of total infections in Rio Linda has been wavy over the last two months, with the number at or below twenty new infections each week for the last six weeks. Over the last 30 days, Rio Linda has seen 49 new cases while Elverta has shown 19 new cases.
New cases in Rio Linda (955673):
- February 1st +16
- February 8th +20
- February 15 +12
- February 22 +8
- March 1 +13
- March 8 +13

- Rio Linda shows a 31 day rolling average of 49, which is down from 51 two weeks ago.
- Elverta shows a 31 day rolling average of 19, down from 33 two weeks ago.
- Sacramento County’s Case Rate is down to 8.2 from 13.1 two weeks ago.
- Sacramento County’s positivity rate is at 3.6% from 4.4% two weeks ago
- Sacramento County has administered over 322k vaccinations, up from 219k to weeks ago.
- The State’s rolling average for Sacramento County is down to 8.97%
- 8.63% of Californians are now vaccinated as of 3/8/21
Rio Linda 95673 has a population of 16,636.
There were 906 COVID-19 cases reported in the 95673 ZIP code during the last year, which is 54.5 cases per 1,000 residents.
About 15.2% of residents live in poverty
About 5.5% live in very crowded homes
About 64.8% are white
2.3% are Black
8.4% are Asian
20.7% are Hispanic
Elverta 95626 has a population of 6,065.
There were 326 COVID-19 cases reported in the 95626 ZIP code during the last year, which is 53.8 cases per 1,000 residents.
About 11.4% of residents live in poverty
About 3.7% live in very crowded homes
About 71.8% are white
2.2% are Black
5.2% are Asian
15.4% are Hispanic
(Very crowded homes are defined as housing units with more than one occupant per room.)


